Trigger Events and the Replication Trap
Part of a series. This article is drawn from the L5 whitepaper on modernizing IT service management, and looks at the mo...
ReadThe license is a fraction of ITSM total cost of ownership. See the 8 hidden costs, how to measure each one, and a formula for cost per request.
 Amey Negandhi
Part of a series. This article is drawn from the L5 white paper on what a fragmented service portfolio really costs to run. Download The Hidden Cost of Fragmented Service Operations.
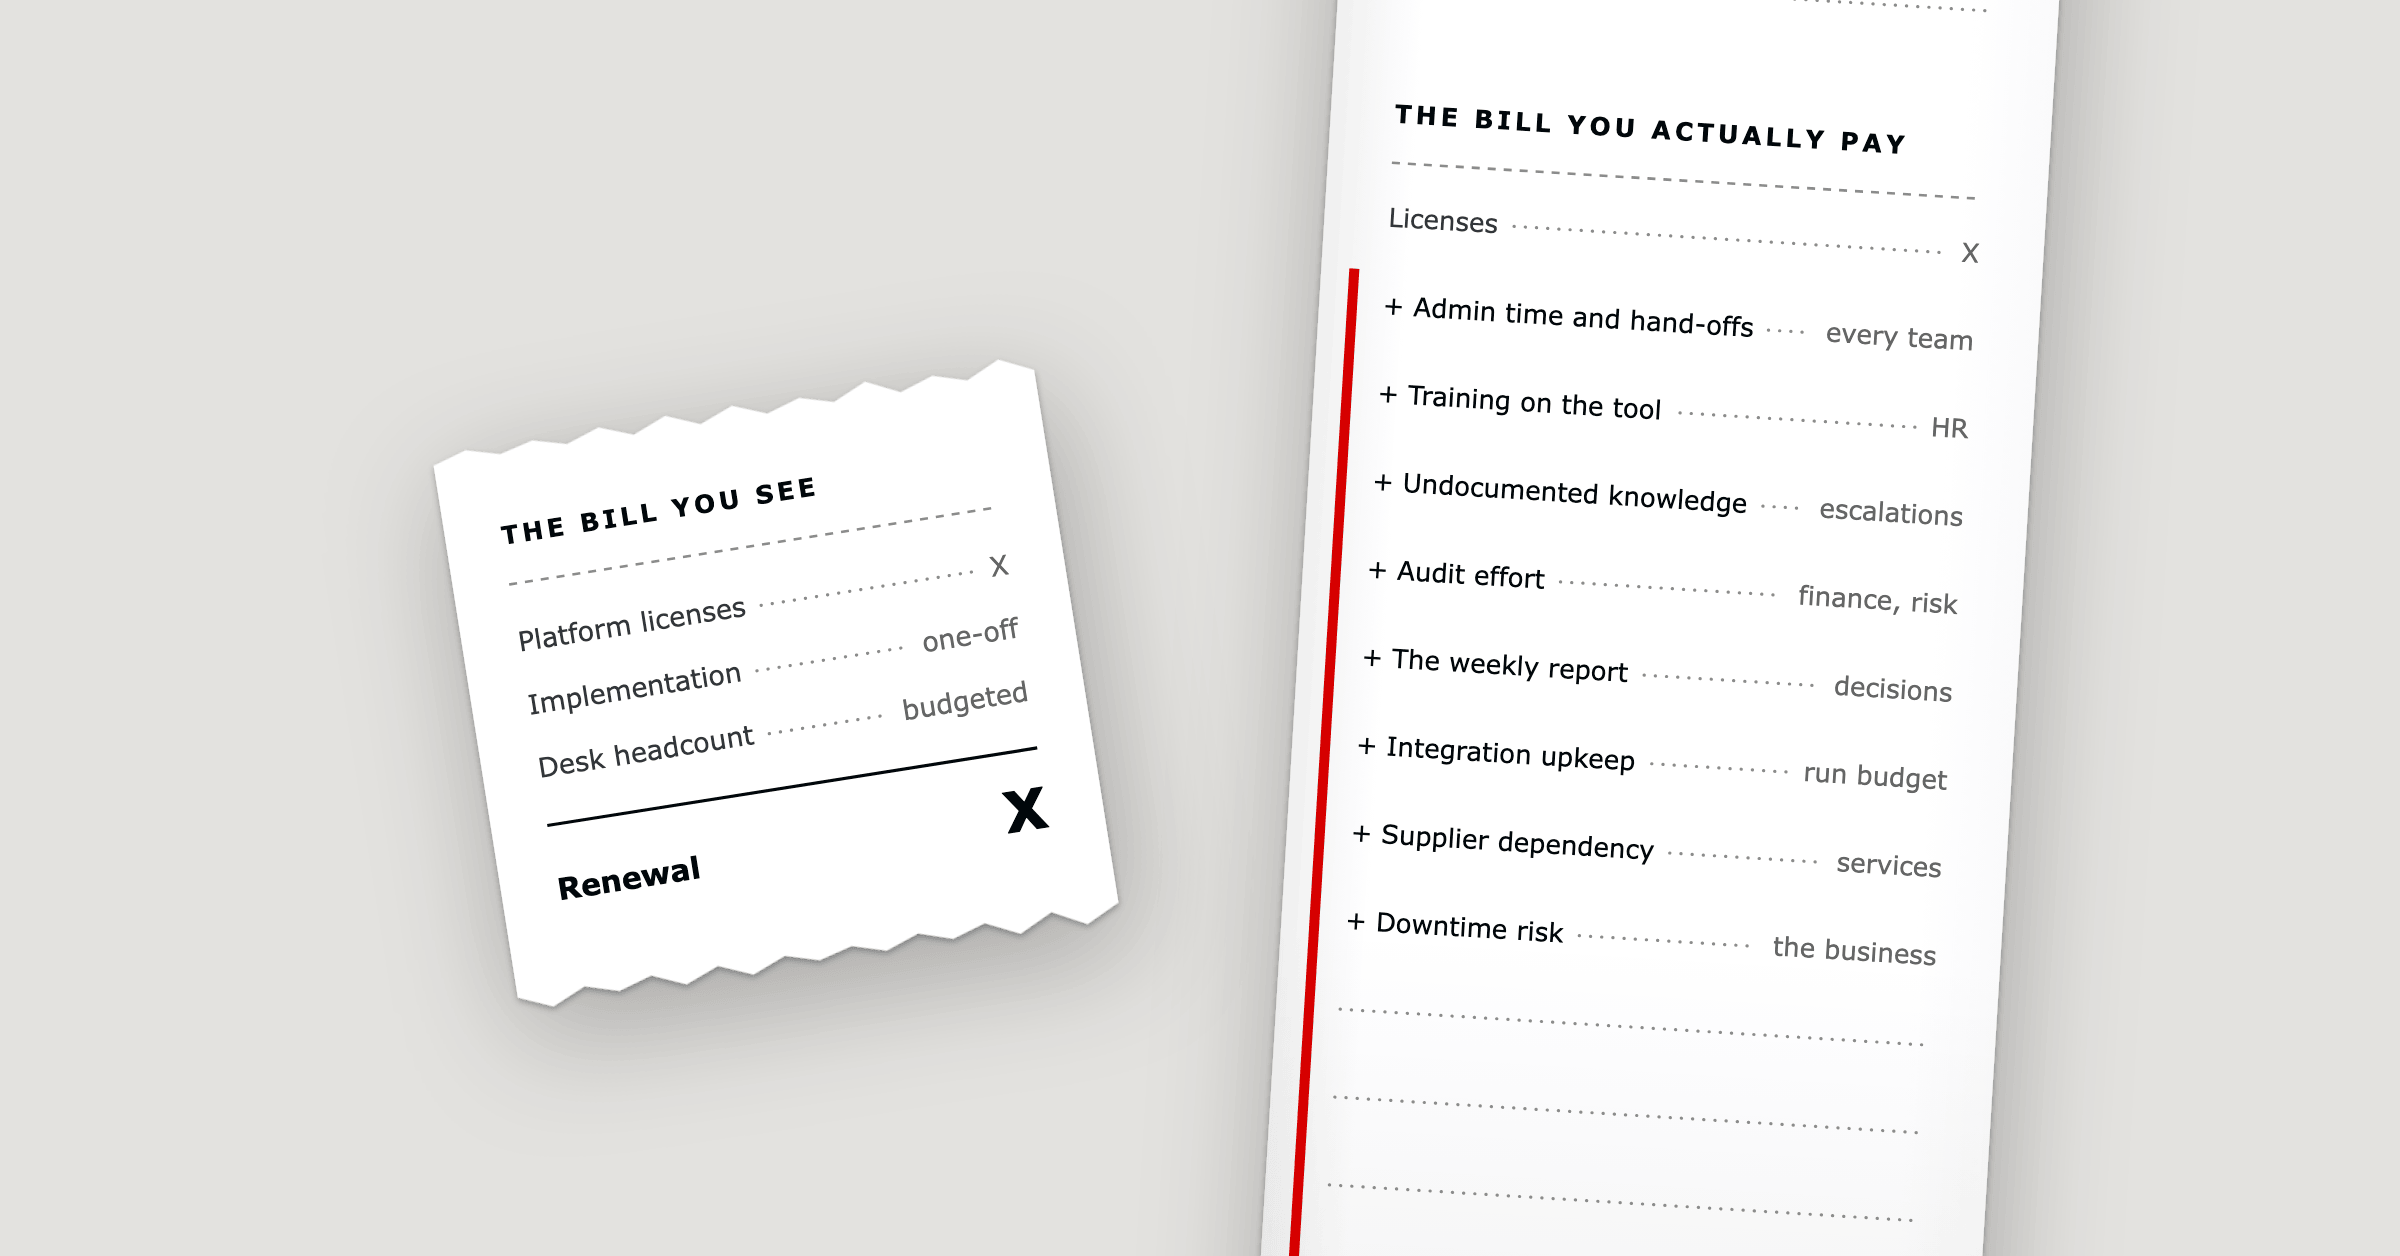
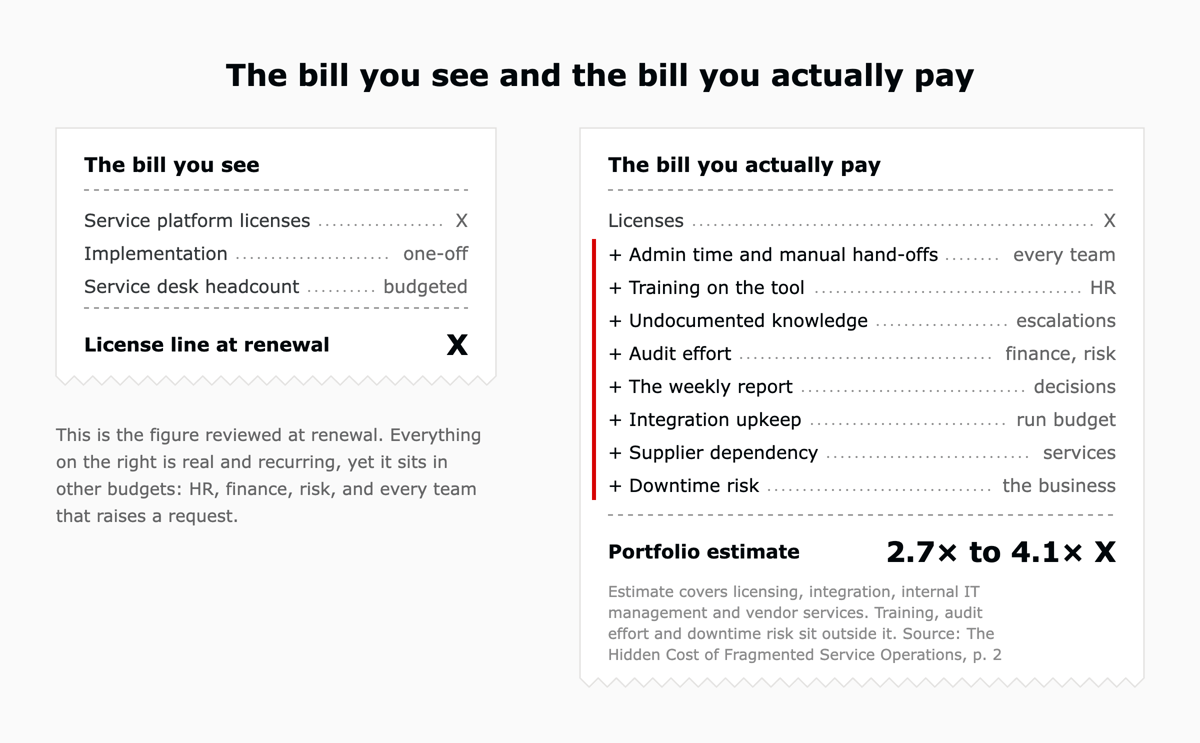
ITSM total cost of ownership is the license plus everything else it takes to run the service. Much of that never appears on the service's budget: admin time, training, undocumented knowledge, audit effort, the weekly report, integration upkeep, supplier dependency and downtime risk. Finance approves the license line. The rest is paid by other teams, in hours, rework and risk.
Each year the renewal arrives, finance approves it, and the figure looks reasonable. On paper, the service desk costs what the license says it does. Our white paper estimates that licensing, integration, internal IT management and vendor services together run 2.7 to 4.1 times the license line, drawing on SaaS portfolio data from Productiv and BetterCloud. Some of the eight costs below sit inside that estimate. Others, such as training, audit effort and downtime risk, sit in budgets it does not count.
This is why legacy service software looks inexpensive. It seldom fails outright. Tickets get closed, the service desk stays open, and the renewal looks modest next to the cost of replacement. The pattern holds in very large IT budgets too. US federal agencies spend about 80 percent of their IT budget operating and maintaining existing systems (GAO), and CIOs surveyed by McKinsey report that 10 to 20 percent of the budget meant for new products goes to resolving tech debt.
Ask what a service platform costs and the answer is usually one number: the license. Total cost of ownership asks a more useful question, which is what the platform costs to own and operate, including training, lost productivity and downtime (IBM, 2025). The distance between those two answers is the hidden cost of operational inefficiency.
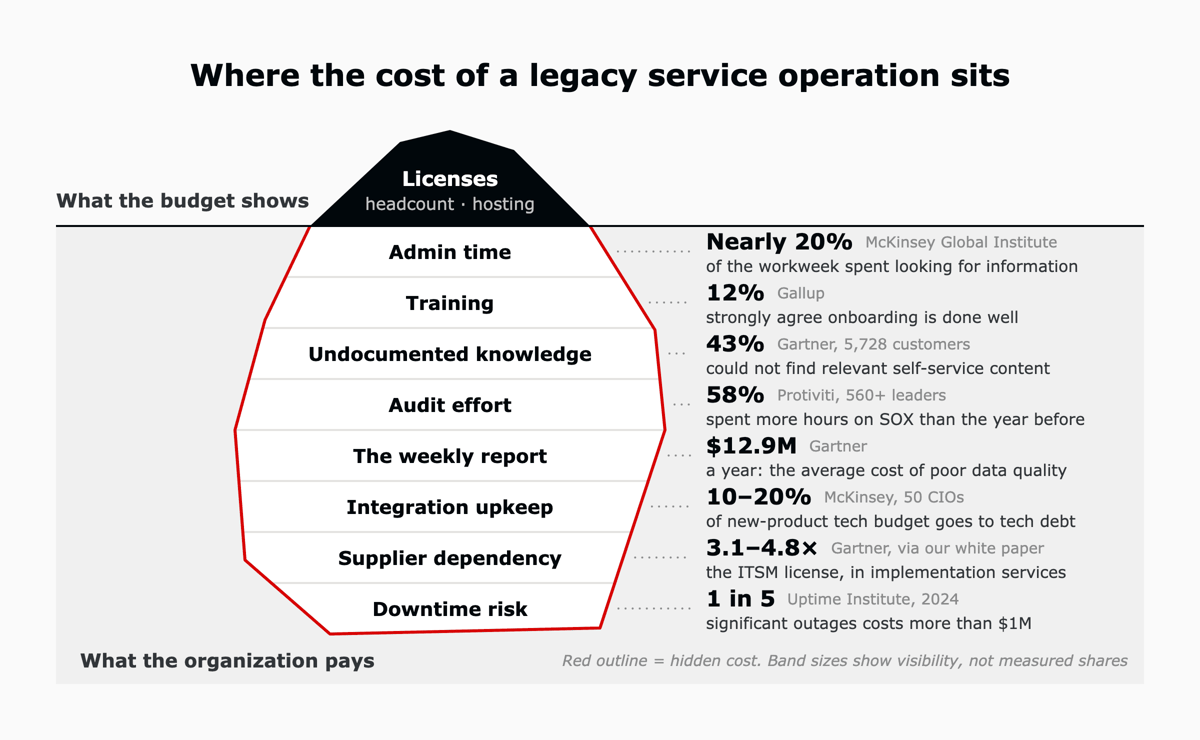
It is the time, rework and risk that fragmented processes, manual work and disconnected systems move onto the rest of the organization. The table sets out where each cost appears and why no budget captures it.
| Hidden cost | How it shows up day to day | Why no budget captures it | What the research shows |
|---|---|---|---|
| Admin time | Agents re-enter the same request in two tools, chase approvals by email and answer repeated requests for updates. | It is spread across every salary, so it never appears as a line item. | Nearly 20% of the workweek goes on looking for information, and 28% on email (McKinsey Global Institute, 2012). |
| Training | New starters and agents spend their first weeks learning the tool before they learn the service. | It is recorded under HR and onboarding. | 12% of US employees strongly agree their organization onboards new employees well (Gallup). |
| Undocumented knowledge | Routing rules, fixes and workarounds live with a few people instead of in the knowledge base. | It surfaces as escalations and key-person risk. | 14% of customer service issues are fully resolved in self-service, and 43% of customers who tried could not find relevant content (Gartner, 2024). |
| Audit effort | Change and access evidence is assembled by hand before each audit. | It is charged to finance, audit and risk. | 58% of companies spent more hours on SOX compliance than the year before (Protiviti, 2023). |
| The weekly report | A spreadsheet is rebuilt each week, counting tickets instead of outcomes. | Its cost shows up in the decisions made from it. | Gartner puts the average cost of poor data quality at $12.9M a year per organization. |
| Integration upkeep | Point-to-point integrations and custom scripts break with each upgrade. | It is absorbed into the run budget as routine maintenance. | 10 to 20% of new-product tech budgets go to tech debt (McKinsey, survey of 50 CIOs, 2020). |
| Supplier dependency | Each change to the platform becomes a paid services engagement. | It is held in a services contract, away from the platform line. | Implementation services run 3.1 to 4.8 times the enterprise ITSM license (Gartner, as cited in our white paper). |
| Downtime risk | Fragile platforms and manual changes make outages more likely and slower to resolve. | It is rarely budgeted until an outage happens. | One in five respondents said their most recent significant outage cost more than $1M (Uptime Institute, 2024). |
John Seddon calls this failure demand: work that exists only because something was not done, or not done well, the first time. A follow-up on a missing laptop, a reopened incident and a second access request for the same system are all repeat work, and each one takes an agent's time as fully as a new ticket.
Failure demand also explains why a self-service portal on its own rarely closes the gap. Gartner puts a live contact at $8.01 and a self-service contact at $0.10, but that saving arrives only when the knowledge behind the portal exists and can be found.
This cost recurs every week and belongs to no one's budget, so no review process is designed to examine it. Project costs are approved as capital expenditure, licenses are negotiated at renewal, and a difficult quarter is put down to a busy period.
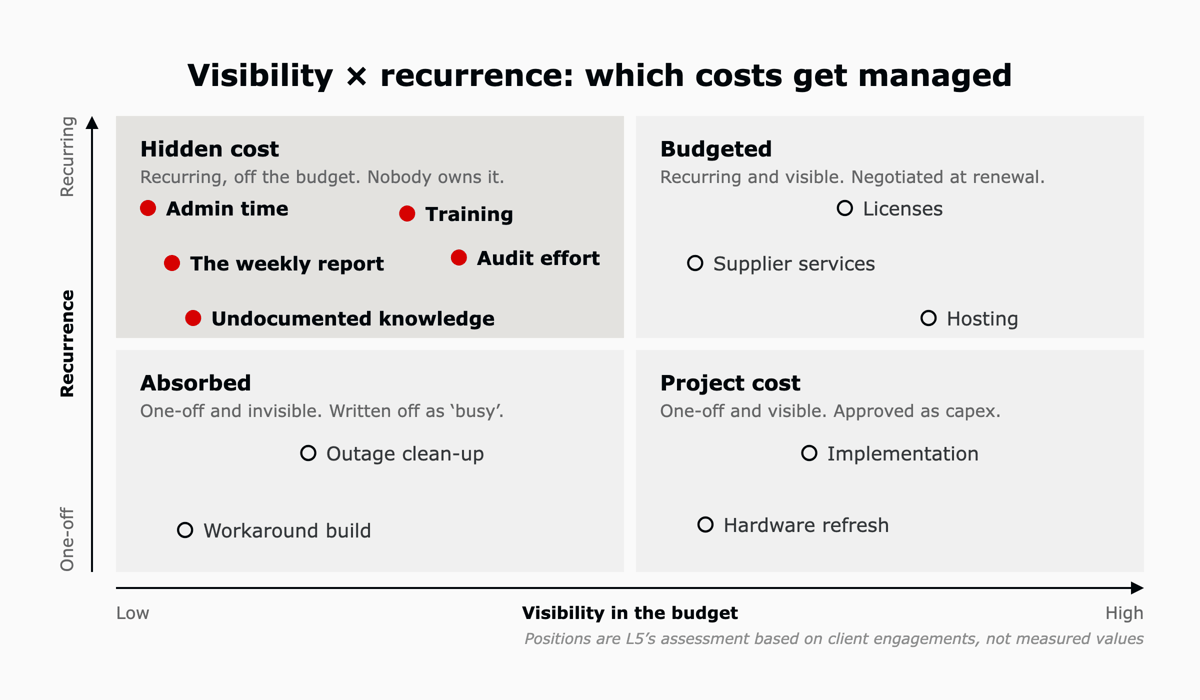
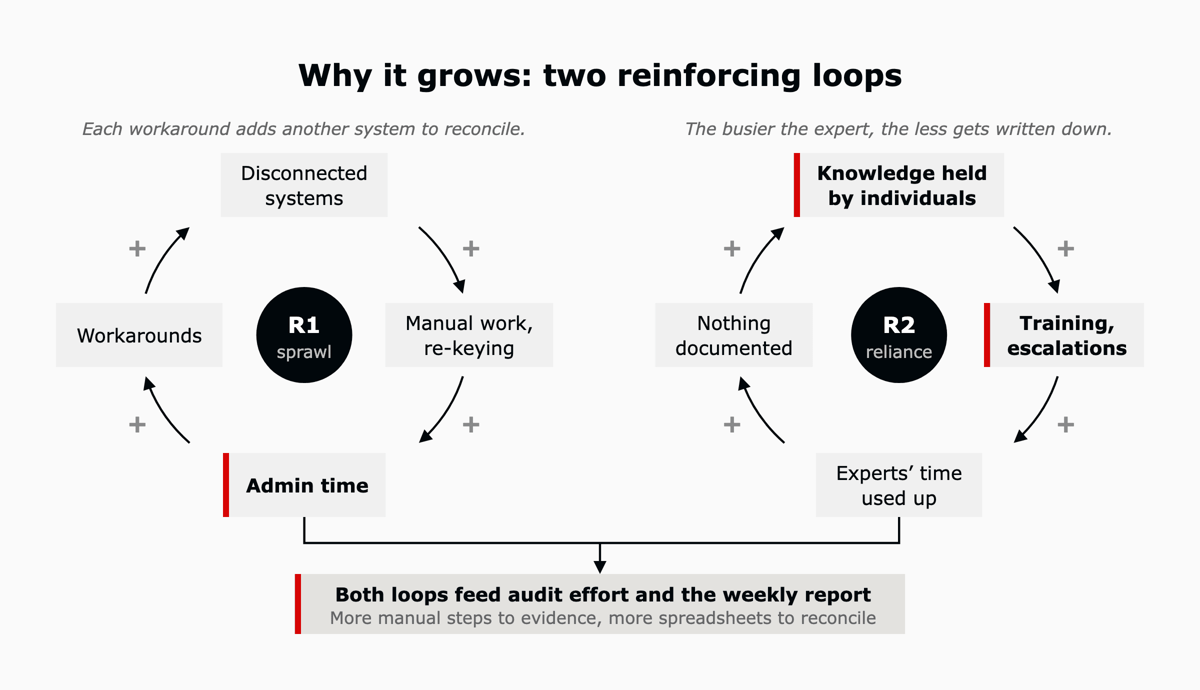
It also grows over time. Disconnected systems create manual work, manual work invites workarounds, and each workaround becomes another system to reconcile. Meanwhile the few people who understand how things work spend their days on training and escalations, which is the time they would need to write down what they know.
Researchers writing in Harvard Business Review observed employees switching between applications about 1,200 times a day, which cost them just under four hours a week in reorientation.
We reviewed our 2026 discovery and delivery calls with six organizations in healthcare, financial services, chemicals, retail and media, plus a company emerging from restructuring. Two are L5 clients and four were prospects at the time. None of these were interviews about cost, yet every organization described at least one hidden cost, often in passing.
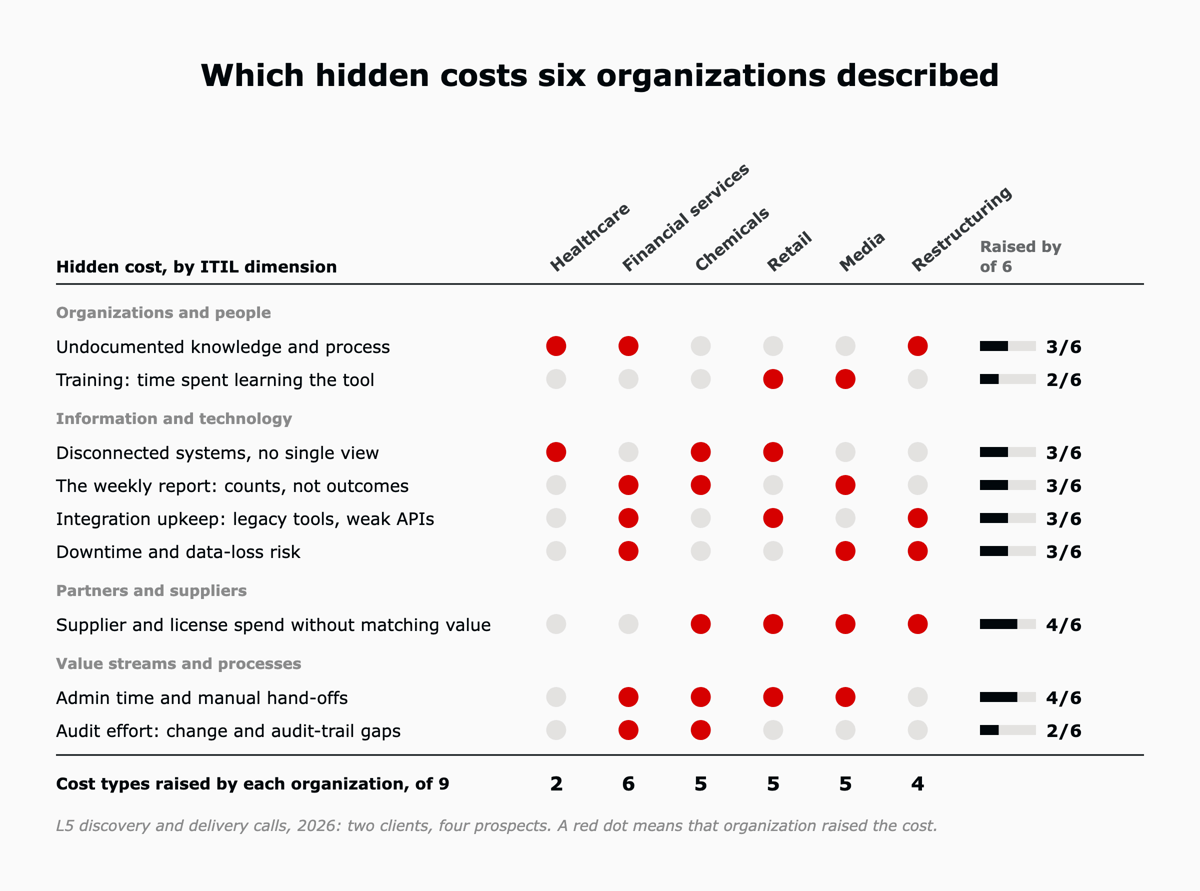
The weekly report and admin time came up most directly:
"The only reporting that we effectively use today in our current system is number of tickets per technician this week. … That is all we have today."
A client in media
"What we don't want to do … is create it so that it takes you 45 minutes to generate the change request in order to … build a USB flash drive."
A client in financial services
Training and undocumented knowledge followed close behind:
"A lot of the training time was actually on the system. How to navigate, what to do here, what to do there."
A retailer we spoke with
"If we're going to go down this road, someone has to maintain that, and it can't be just me."
A client in financial services
One example shows the pattern. A chemicals company partway through three acquisitions told us the businesses it was bringing together ran on different service tools, one of them an enterprise platform: “it’s all fragmented.” Each tool still worked on its own, so the cost sat in the work between them.
Government auditors, analyst firms and academic researchers point the same way. Their figures describe different populations, so read them as indicators of direction and scale.
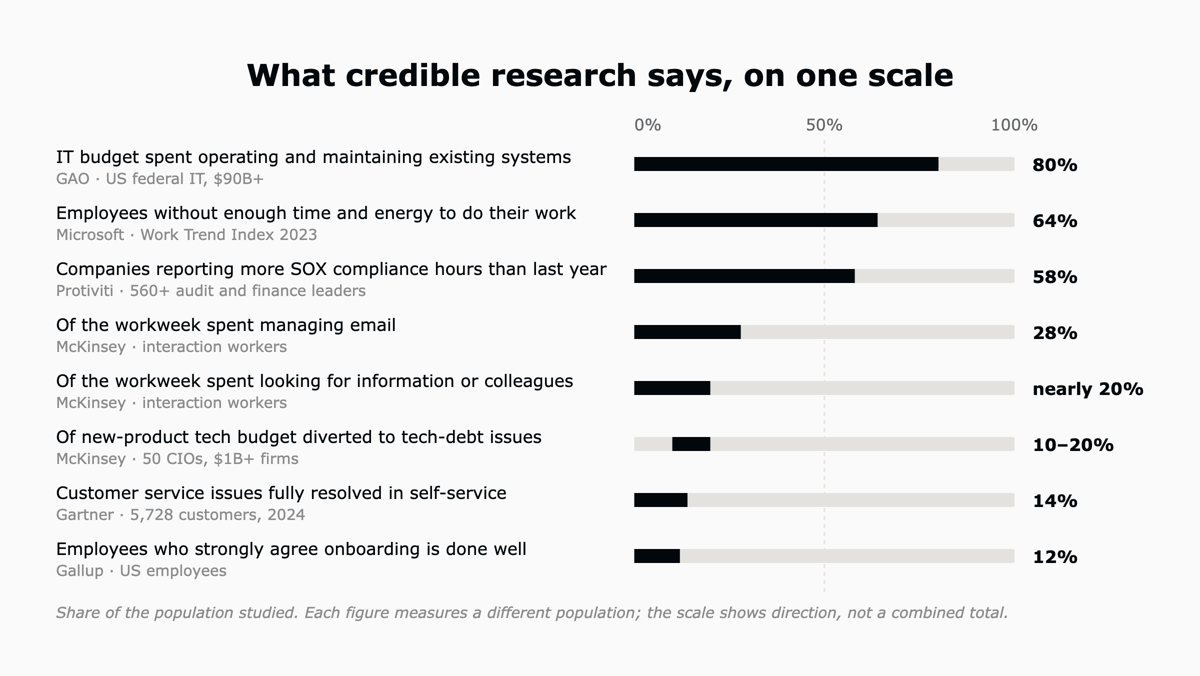
No single study measures the whole cost. Read together, they show much of the money, and much of every working week, going into keeping existing operations running, mostly outside the budget that owns the service. Two findings cited in our white paper complete the picture. Gartner puts implementation services for enterprise ITSM at 3.1 to 4.8 times the license, and IDC found that platforms run by a dedicated operator kept 89 percent of their initial deflection rate at 18 months, against 51 percent for platforms run by IT generalists as a secondary job.
Five established frameworks turn a hidden cost into a number. Used together, they settle what a budget owner needs to know before acting: how large the cost is, how much of it is avoidable, where it originates, what a single request costs and who owns it.
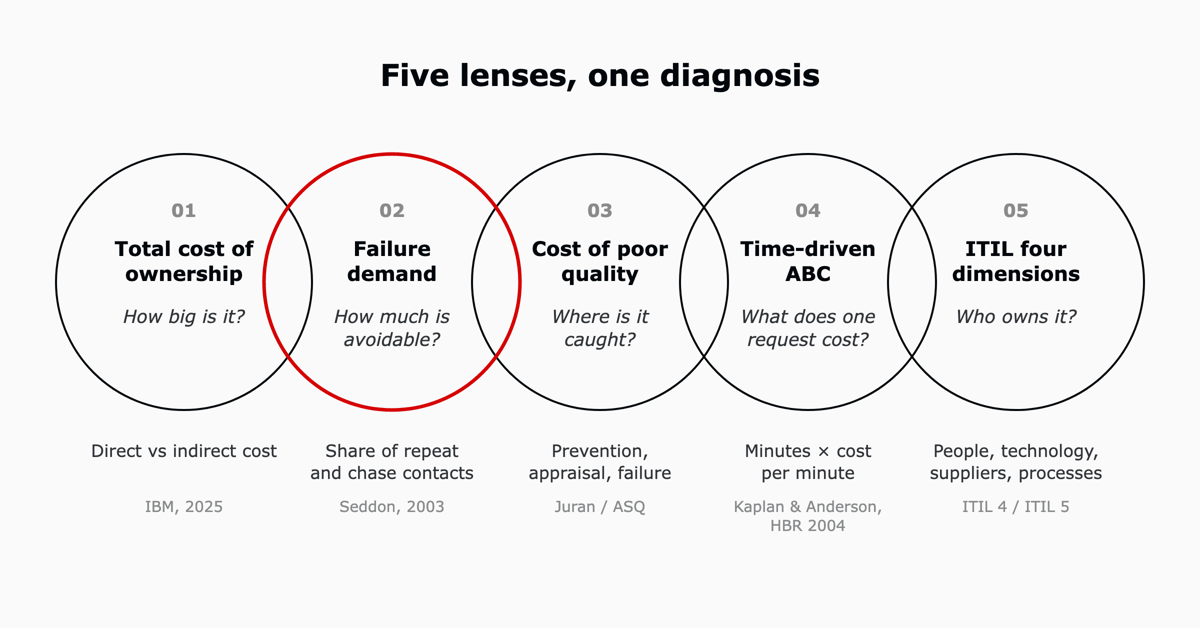
Kaplan and Anderson's time-driven activity-based costing needs two estimates: the cost of a minute of team capacity, and the minutes each request type consumes, including follow-ups and rework. They recommend basing the cost per minute on practical capacity, usually around 80 percent of paid time, since no team is productive for every paid minute.
Cost per request type equals minutes per request, including chasing, switching and rework, multiplied by cost per minute, which is team cost divided by practical capacity.
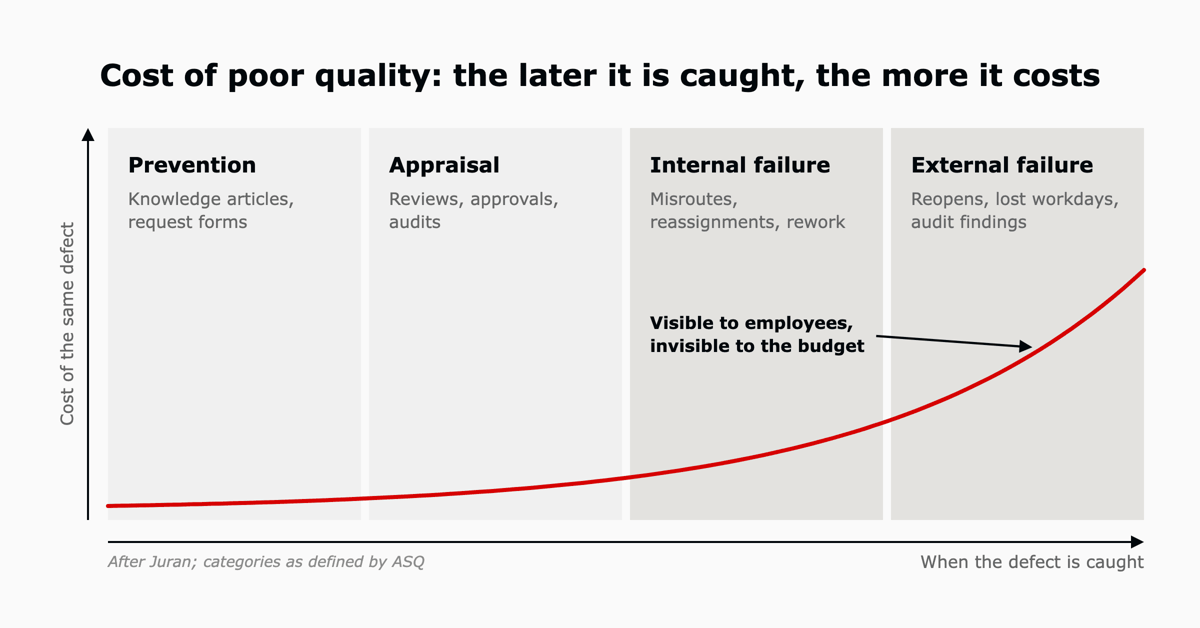
The cost-of-quality model, after Juran and as defined by ASQ, shows where hidden cost builds up. Prevention and appraisal are planned and visible, and failure is neither. External failure, such as a reopened incident or an audit finding, is the most expensive category and the least visible to the budget.
Most organizations respond with a platform decision. Each option fixes something real, yet most leave the recurring, off-budget costs in place, because those costs live in process and ownership.
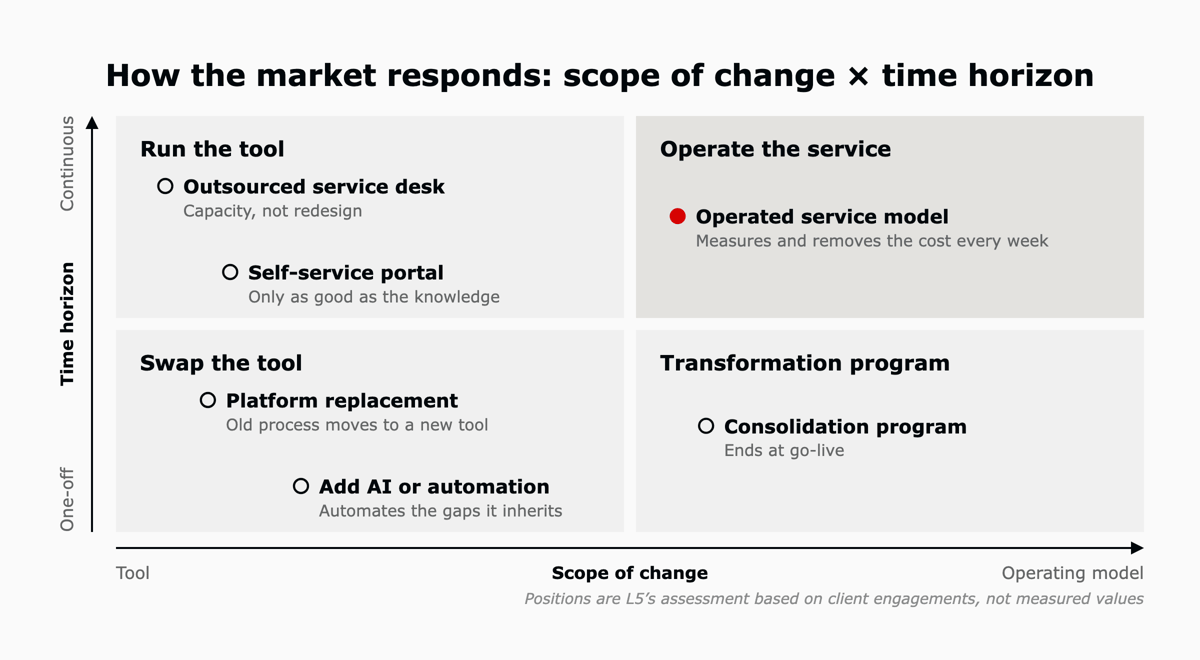
| Approach | What it improves | What it leaves behind |
|---|---|---|
| Platform replacement | Tooling, features and support. | The old process, rebuilt on the new tool. Training and audit effort start again. |
| Self-service portal | Channel cost. | Undocumented knowledge. The portal is only as good as its content. |
| AI and automation | Speed on routine requests. | Gaps in knowledge and process, which now run automatically. |
| Outsourced service desk | Capacity. | Supplier dependency, with services spend continuing after go-live. |
| Consolidation program | Duplicate tools and switching. | An end date at go-live, after which the savings drift without an owner. |
AI deserves its own caution. Automating a process that nobody owns speeds up the same gaps, which is the subject of the hidden cost of unoperated AI.
L5 deploys and operates AI on purpose-built service management platforms, Zendesk, ClickUp and Workday, for mid-market organizations. We treat hidden cost as an operating problem, and our three motions map onto ITIL's continual improvement model.
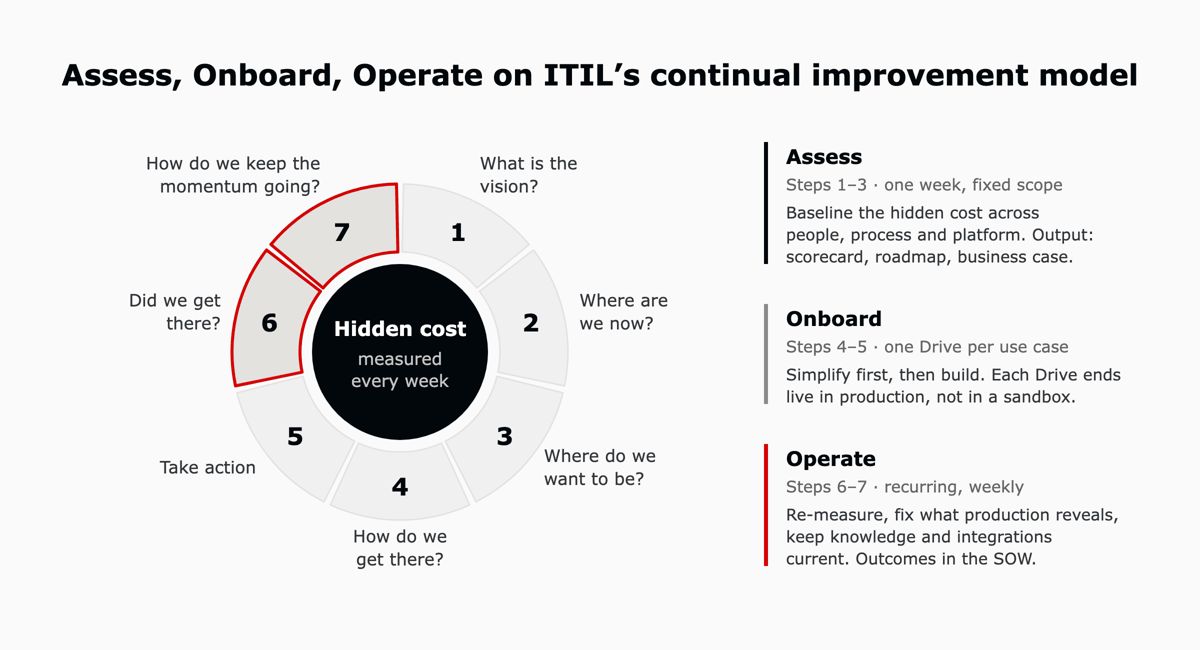
Assess takes one week and ends with a maturity scorecard, a roadmap and a business case. Onboard puts the first use case live in production by week three, with trained users and the next Drive in the backlog. Operate runs every week, with a scorecard, production changes and an updated roadmap. Each Drive ends with a defined change in production, and done is agreed before the Drive begins.
| Stage | Typical approach | L5 approach |
|---|---|---|
| Starting point | Compare platforms on license and features. | Assess in week one: maturity scorecard, roadmap and business case. |
| Design | Replicate today's process on a new tool. | Simplify first, using ITIL practices as the standard. |
| Delivery | One large project that ends at go-live. | One Drive per use case, each live in production. |
| After go-live | Ad hoc services, billed as needed. | Weekly operation, with outcomes committed in the SOW. |
| Measurement | SLA attainment and ticket volume. | A weekly scorecard of what the platform and its AI produce. |
| Ownership | Split across IT, HR and the vendor. | One accountable operator. |
The operator is the part a one-off program leaves out. Fewer than 10% of L5's 600+ customers reach Operated without an active operator. Our ACT methodology (Accelerated Customer Transformation) compressed ClickUp onboarding from 55 days to 7.
It is everything it costs to own and run an ITSM platform beyond the license: integration, internal IT management and vendor services, plus costs that land in other teams' budgets, such as admin time, training, audit effort, the weekly report and downtime risk.
Our white paper estimates that licensing, integration, internal IT management and vendor services together run 2.7 to 4.1 times the license line. Training, audit effort and downtime risk sit outside that estimate.
The renewal only shows the license. Licensing, integration, internal IT management and vendor services together run an estimated 2.7 to 4.1 times the license line, and the eight hidden costs sit in HR, finance, risk and every team that raises a request.
Add integration, internal IT management and vendor services to the license, then price the time the service consumes elsewhere with time-driven activity-based costing: the minutes each request type takes, including chasing and rework, multiplied by the cost per minute of practical capacity.
It rarely does on its own. A replacement usually moves the old process onto a new tool, so training and audit effort start again. The cost falls when someone owns the process after go-live and measures it every week.
The white paper sets out the cost mechanisms of a fragmented service portfolio in full. To see where your own operation stands, book an assessment: in one week you get a maturity scorecard, a roadmap and a business case.
Full citations in The Hidden Cost of Fragmented Service Operations.

The full article with its figures, tables and sources, set for reading offline, printing, and sharing.
On its way to your inbox You can also download it right now.
Download the PDF Last updatedKeep reading
Part of a series. This article is drawn from the L5 whitepaper on modernizing IT service management, and looks at the mo...
Read
Part of a series. This article is drawn from the L5 whitepaper on modernizing IT service management, and maps the proble...
Read
Part of a series. This article is drawn from the L5 white paper on modernizing IT service management, and looks one laye...
ReadField notes on AI operations and service management, direct to your inbox. New insights, the week we publish them.
No spam. Unsubscribe any time.