ClickUp's Gantt chart and Timeline view both draw tasks as bars on a calendar, and they answer different questions. Gantt shows dependencies and cascading reschedules. Timeline groups work by team or assignee to show who is busy when.
-
/
3 min watch
Chapters
Two views that look alike
Gantt and Timeline both place a project's tasks as bars on a calendar. This walkthrough uses one website launch project, eleven tasks from kickoff to go-live, in both views to show which question each one answers.
Gantt: how the work connects
The arrows in a Gantt chart are dependencies. Wireframes cannot start until discovery and stakeholder interviews are done, and design sign-off waits on the final visual design. When a task slips, dragging its bar moves every dependent task with it, so the chart shows what one delay does to the rest of the plan.
Timeline: who is busy
Timeline view groups tasks into lanes, here by a Workstream custom field so each team gets its own row. Overlapping bars show crunch periods, such as design and content working at the same time in late October and early November. Grouping by assignee instead shows who is carrying the most work at once.
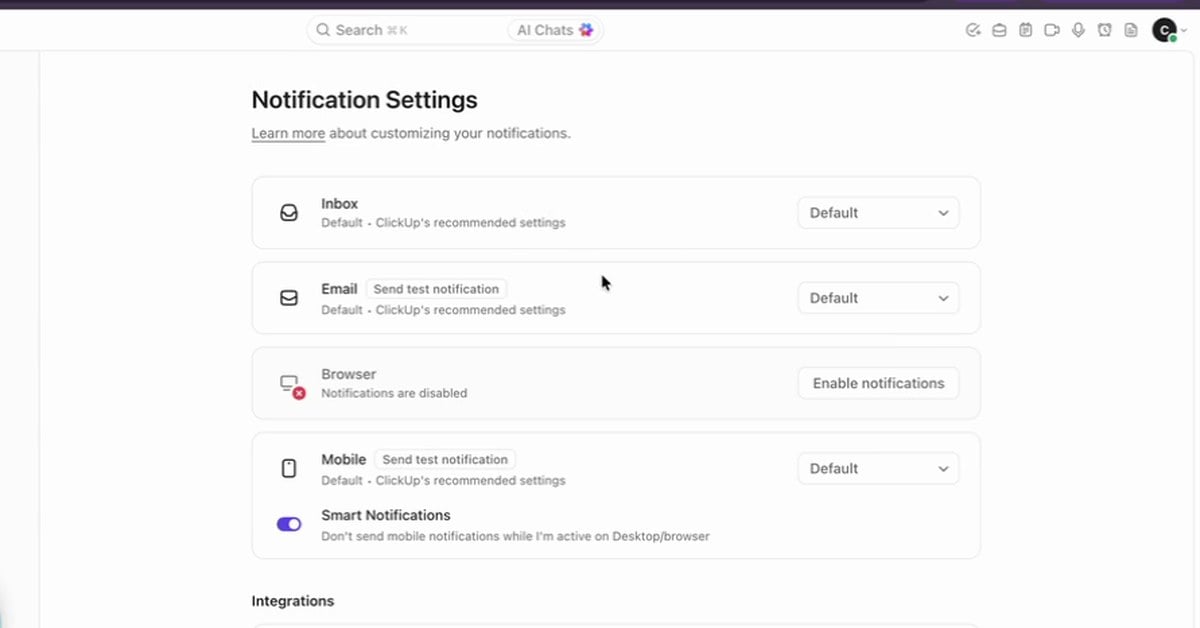
ClickUp's Inbox collects every update in one place, and notification settings decide what reaches your email, browser and phone. How to work the Inbox and set custom notifications so only what matters reaches you.
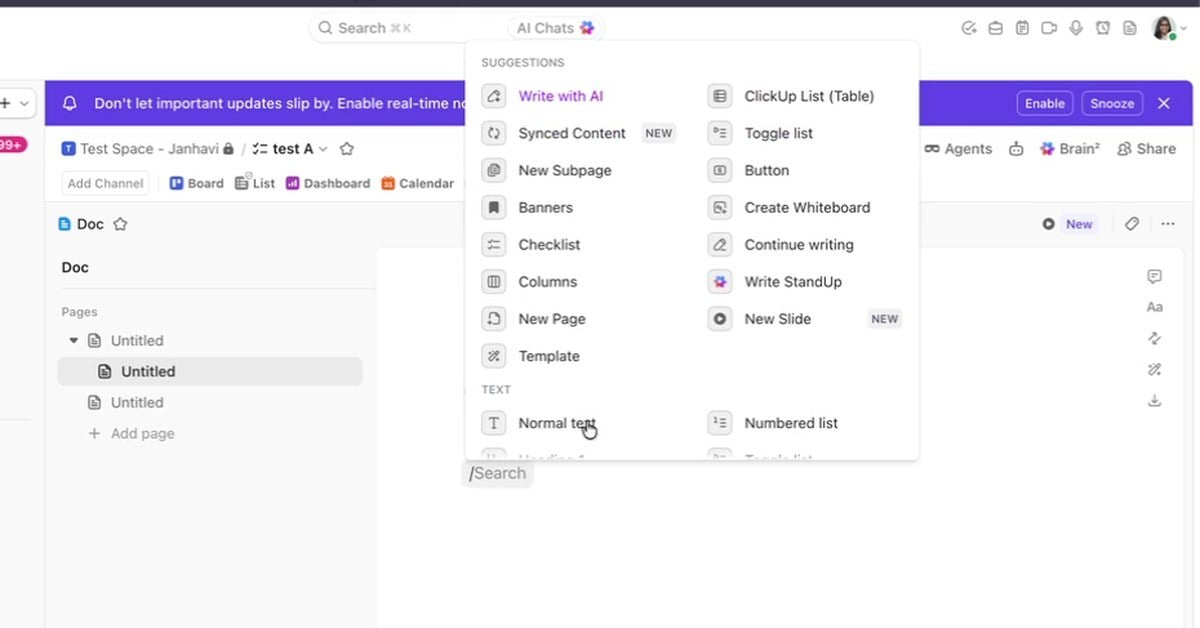
ClickUp Docs keep a team's documentation next to its work. How to build a doc with pages and slash commands, comment inside it, mark it as a wiki and control who can open it.
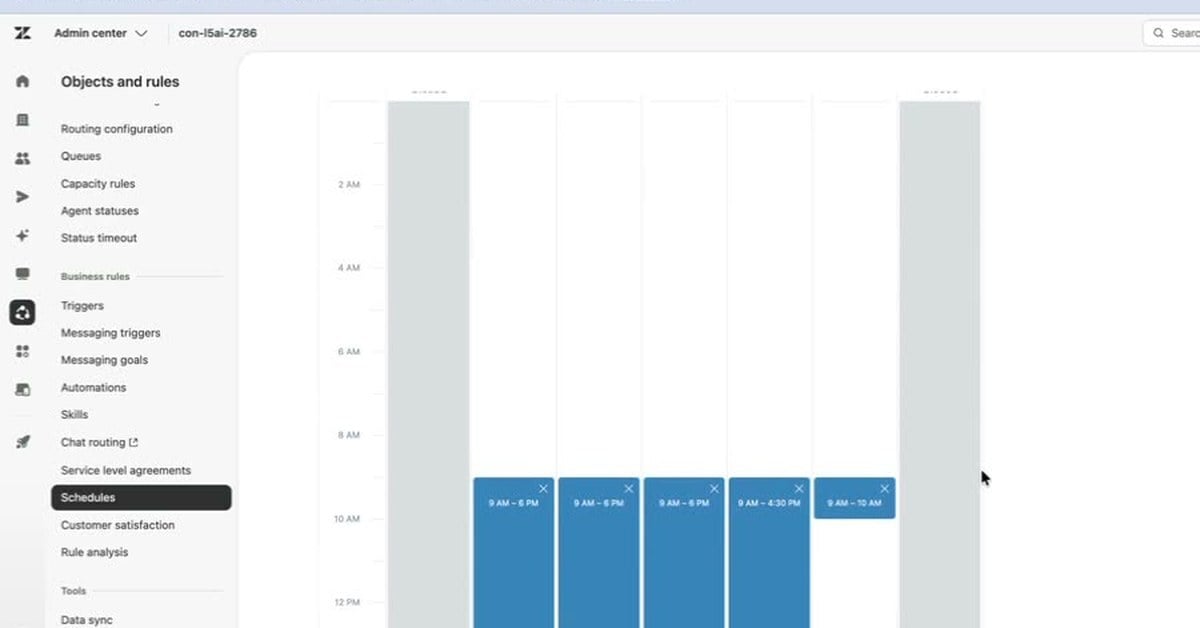
A Zendesk schedule sets your business hours and holidays, and the triggers, views and automations that use business hours follow it. How to set one up and test it with an after-hours auto-reply.
3 min/Oct 2026
Watch
New resources, as soon as they land.
Whitepapers, datasheets, recorded sessions, and field notes on operating AI. Straight to your inbox, the week we publish.