ClickUp Status Cards Explained
Video
When work is spread across several lists, no single list shows where it stands. How status cards on a ClickUp dashboard show the split of tasks by status, how long tasks sit in each status, and how that changes over time.
Chapters
Every status on one screen
Managing a project means knowing how many tasks are in progress, what is stuck and what is done. When the work is spread across several lists, no single list gives that overview. A dashboard with status cards brings every status together, so bottlenecks show up without opening each list.
The status cards
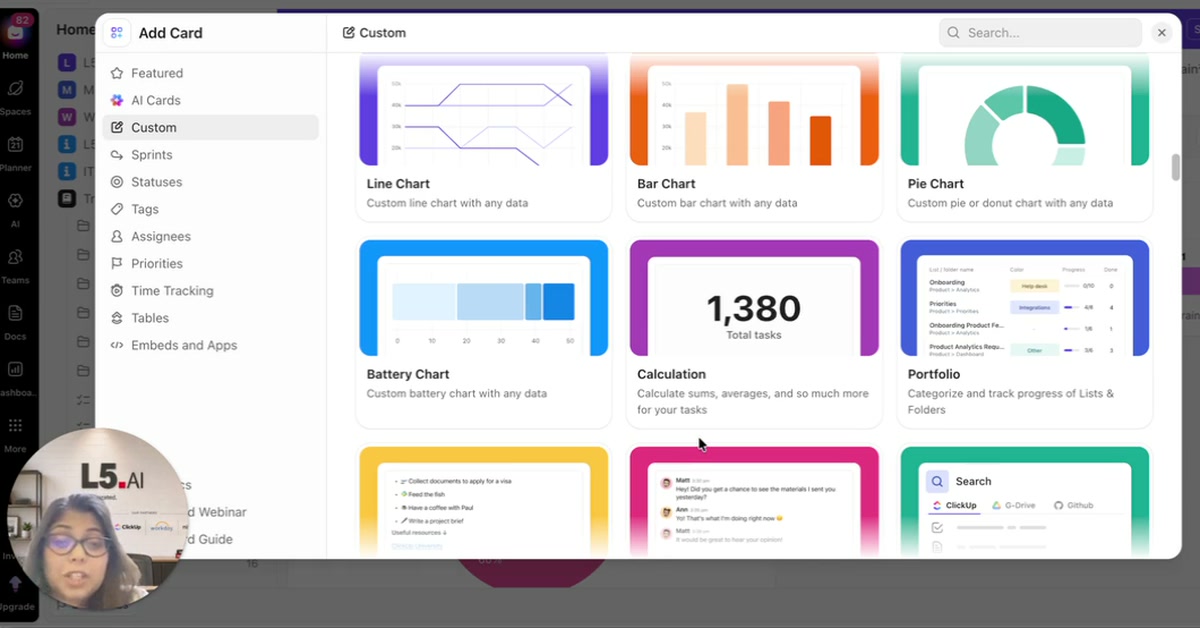
This walkthrough opens a Hiring dashboard with the cards already built. Workload by Status splits every task by status, here as a pie chart, and the same data can be shown as a battery chart or a bar chart, whichever the team reads best. Total time in Status shows how long tasks have sat in each status, and a status that holds work for weeks marks where it is getting stuck. Status Over Time tracks how the count in each status changes across a period.
Adding more
Searching for status in the + Card library lists the default status cards. Custom cards can group by status, assignee or other fields. Name each card for what it shows, so anyone reading the dashboard knows what it is looking at.