Trigger Events and the Replication Trap
Part of a series. This article is drawn from the L5 whitepaper on modernizing IT service management, and looks at the mo...
ReadThe five ITSM pain points IT teams raised most in our calls, what each costs the service desk, why AI does not fix them, and where to start.
 Divyansh Agrawal
Part of a series. This article is drawn from the L5 whitepaper on modernizing IT service management, and maps the problems that hold a service desk back before any platform decision. Download Modernizing IT Service Management.
The ITSM pain points that come up repeatedly in L5's discovery and delivery calls with IT teams are fragmented tools and no centralized view; poor reporting and limited visibility; outdated technology and weak APIs; disconnected systems and workflows; and manual processes that slow resolution and do not scale. Each one slows resolution on its own. Together, they make it hard for IT leaders to see where a service desk spends its time.
The examples below come from calls held in 2026 with IT teams in banking, media, healthcare, transport, senior living and philanthropy, among others. Most were prospects at the time, and none is named.
The five below come up most often in our calls. The table shows what each one looks like day to day and what it costs.
| Pain point | What the team sees | What it costs |
|---|---|---|
| Fragmented tools and no centralized view | Records and requests spread across several tools | Time spent finding information before work can start |
| Poor reporting and limited visibility | Reports limited to ticket counts per technician | No basis for staffing or budget decisions |
| Outdated technology and weak APIs | Tools with hard limits and integrations that fail | Workarounds that someone maintains by hand |
| Disconnected systems and workflows | Handoffs between teams with no shared record | Requests that stall between teams |
| Manual processes that slow resolution and scale poorly | Email intake and manual routing | Misrouted tickets and a growing backlog |
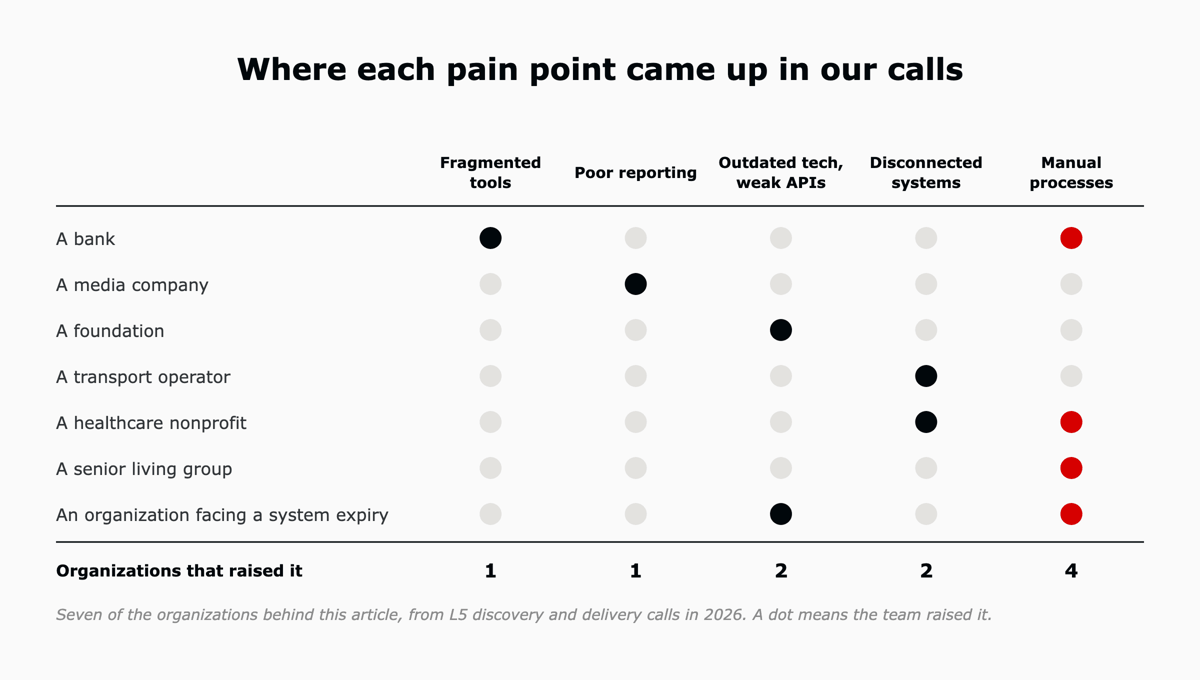
Across the organizations behind this article, manual processes came up most often, raised by four of the seven shown below.
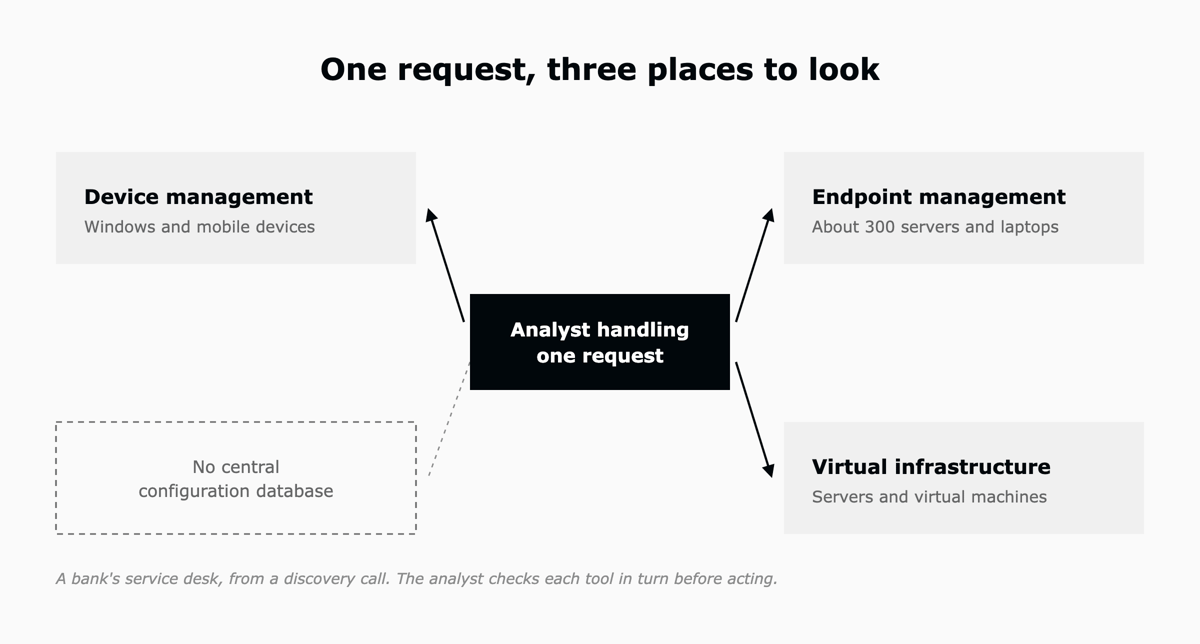
To answer a single request, analysts at one bank work across three separate tools: device management for Windows and mobile devices, an endpoint management tool covering about 300 servers and laptops, and a virtual infrastructure console. There is no central configuration database, so the analyst checks each tool in turn before acting. Running the endpoint and the service desk as one system is how that gap closes.
Gartner found that 47 percent of digital workers struggle to find the information they need to do their jobs, and that the average desk worker used 11 applications, up from six in 2019. The survey ran in late 2022 across 4,861 employees.
Reporting is often the thinnest part of a legacy desk. One media team told us its only regular report counted tickets per technician each week, the example we take apart in our article on how legacy systems hold back AI. A report like that shows how busy the desk was, and nothing about whether requests were resolved, how long employees waited, or which services generated the work.
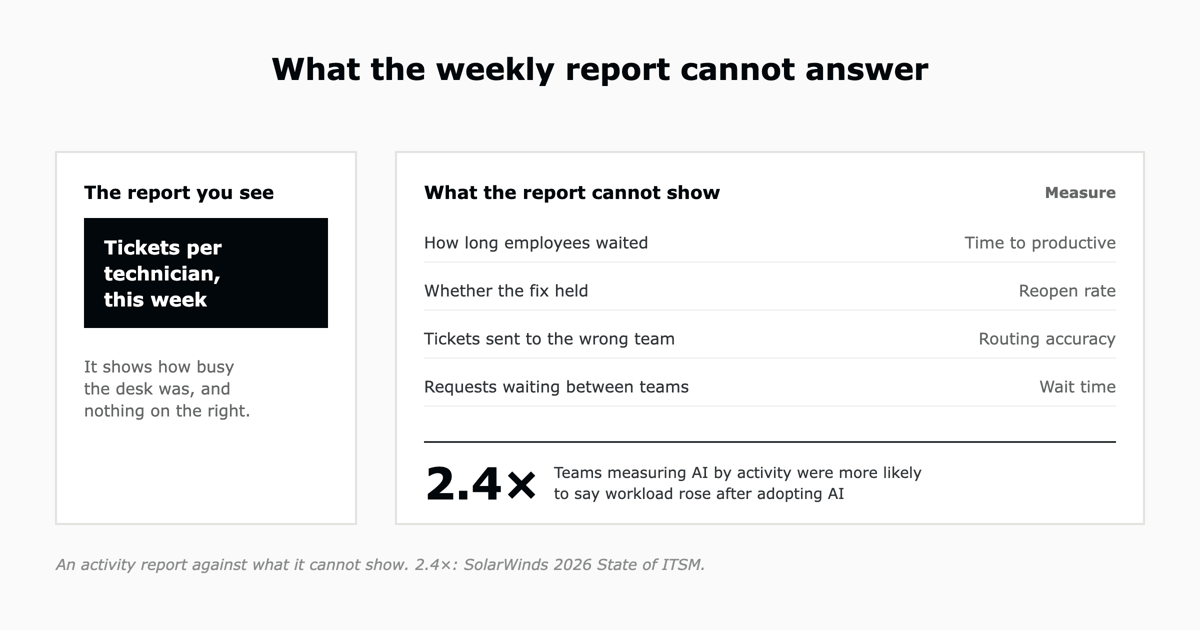
The same measurement habit carries over once AI arrives. In SolarWinds' 2026 State of ITSM survey of 844 IT professionals, teams that measured AI by activity rather than by results were 2.4 times more likely to say their workload had increased since adopting AI.
One organization we spoke with was running a service system with a hard expiry date in October, so every month spent deciding was a month less to move. At a foundation, a sync between the asset management tool and the service platform failed until the team corrected how URLs were formatted in its settings. And at a financial services client, the old change tool's desktop app could not export its own user list, so the data had to be copied out by hand before the migration.
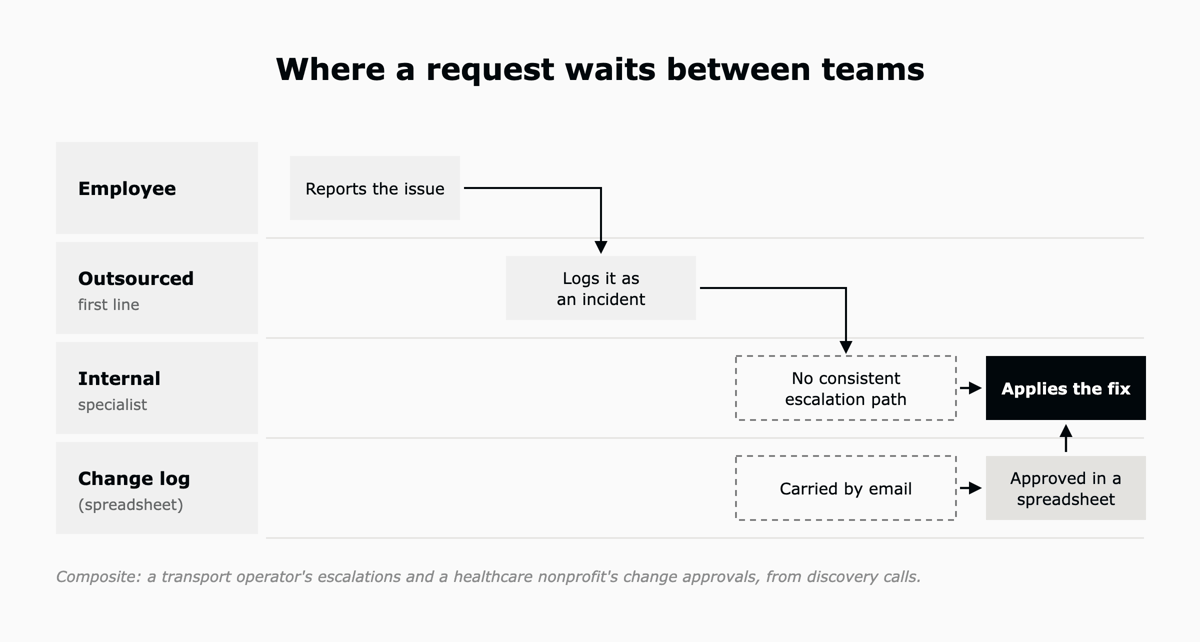
A transport operator with an outsourced first line handled every request as an incident, so escalations from the outsourced team to internal specialists did not follow a consistent path. A healthcare nonprofit tracked tickets in one system and ran change management in a spreadsheet tool, with email carrying requests between them. It also carried about 785 open tickets that needed cleanup.
A 2022 Harvard Business Review study of 137 users across three Fortune 500 companies found people toggled between apps and websites nearly 1,200 times a day, and spent just under four hours a week reorienting after those switches.
A senior living group supports about 800 users across a corporate office and its communities through a case tool and email. Nothing classifies requests by support level, so MFA, VPN and login issues wait for a person to sort them. At the bank above, only about 10 percent of users use the self-service portal, and most requests still arrive by email.
SolarWinds' 2024 State of ITSM report, drawn from anonymized data across its own service desk customers, found that automation rules saved about three hours per ticket, and that teams using knowledge base articles resolved incidents an average of six hours faster.
AI speeds up individual tasks while relying on the same device records and ticket queue as the people it supports. If the five pain points above are present, an AI layer starts from the same scattered records and the same misrouted queue, the copilot ceiling we describe in why enterprise AI stalls.
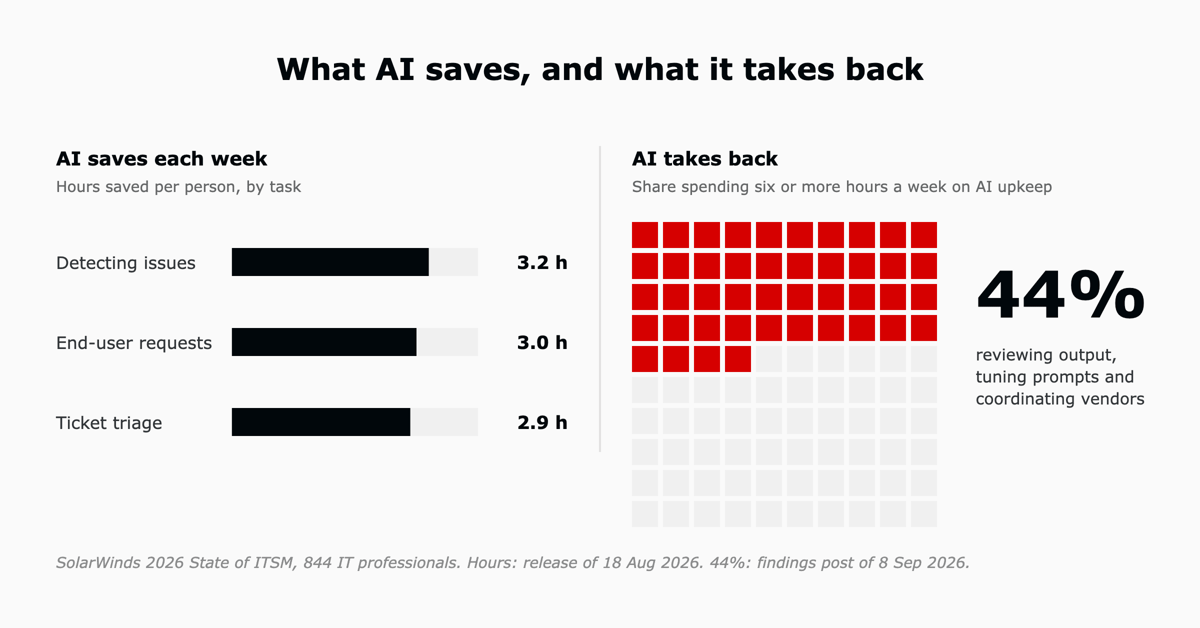
The time AI saves can also be taken back. In SolarWinds' 2026 survey, respondents said AI saved them about three hours a week on each of detecting issues, handling end-user requests and triaging tickets. Yet in SolarWinds' own write-up of the findings, 44 percent said they spend six or more hours a week on AI maintenance, such as reviewing output and tuning prompts.
The useful ITSM metrics track how long employees wait and how often requests land in the wrong place. The table pairs each pain point with the metric teams tend to report and the measure that shows the problem.
| Pain point | Activity metric often reported | Measure that shows the problem |
|---|---|---|
| Fragmented tools and no centralized view | Assets logged | Share of devices with one current record |
| Poor reporting and limited visibility | Tickets closed per technician | Time to productive, by request type |
| Outdated technology and weak APIs | Number of integrations | Requests that need data re-entered between systems |
| Disconnected systems and workflows | Escalations sent | Time a request waits between teams |
| Manual processes that slow resolution and scale poorly | Tickets handled per day | Share of tickets routed correctly the first time |
Time to productive runs from the moment a person reports a problem to the moment they are confirmed working again. Taking each measure by request type shows which pain point costs the desk the most hours.
Start with the request type that arrives most often and takes longest to resolve. Map where it starts, which tools it passes through and where it waits, then fix the records, routing and handoffs that one request touches. One request type, fixed and measured, gives the team a baseline and a business case for the next.
The pain points IT teams raise most often in our calls are fragmented tools and no centralized view, poor reporting and limited visibility, outdated technology and weak APIs, disconnected systems and workflows, and manual processes that slow resolution and scale poorly.
AI draws on the same data and queues as the people working alongside it. If tickets are misrouted or records are scattered, the AI starts from the same faulty place.
Replacement makes sense when a tool hits a hard limit, such as an item cap, an expiry date or an export it cannot do, and moving the data costs less than continuing to work around the limit. If the platform fits and the process is the problem, optimizing the current deployment is often the better route.
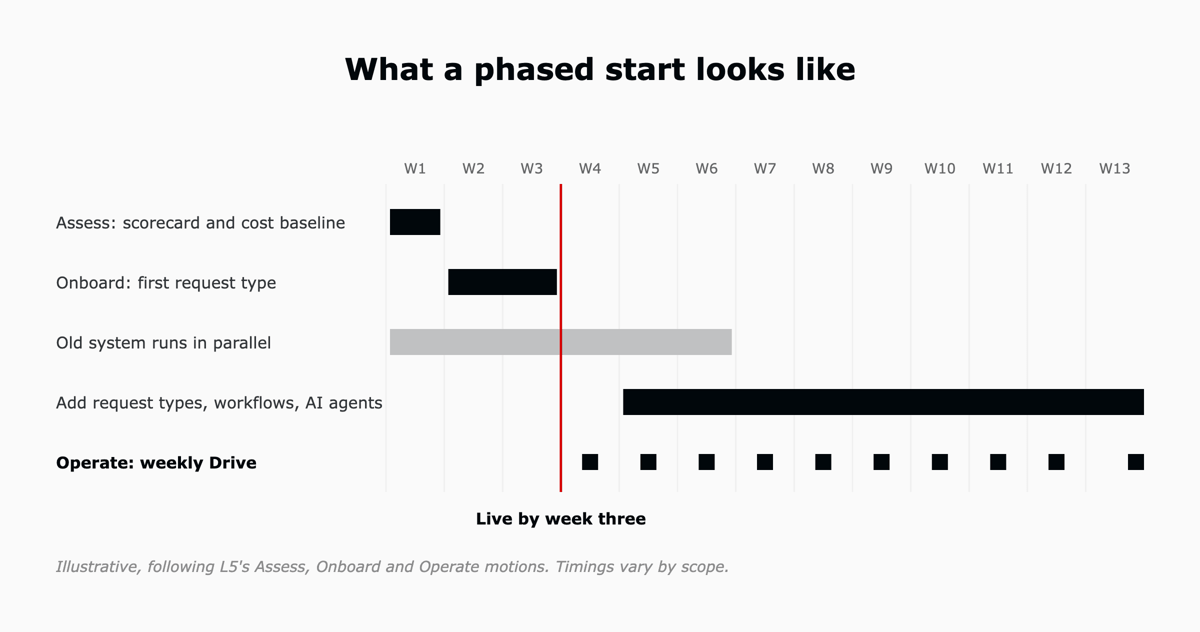
L5 deploys and operates AI on purpose-built service management platforms, Zendesk, ClickUp, and Workday, for mid-market organizations. An L5 operator stays accountable for what the system produces after go-live and runs a weekly Drive that changes the routing, knowledge and integrations behind each request type. The table shows what that operator changes for each of the five pain points.
| Pain point | What an L5 operator changes |
|---|---|
| Fragmented tools and no centralized view | Brings device and asset records into one view on the service platform, for example by connecting NinjaOne to Zendesk |
| Poor reporting and limited visibility | Builds dashboards on resolution time, SLA compliance and backlog by request type, alongside ticket counts |
| Outdated technology and weak APIs | Recommends whether to optimize, augment or replace the current tool, then migrates in phases, with a go or no-go decision and the old system running in parallel |
| Disconnected systems and workflows | Configures routing, approvals and integrations so each request keeps one record from intake to fix |
| Manual processes that slow resolution and scale poorly | Sets up intake forms, automated routing and AI agents for high-volume requests, then changes them in each weekly Drive |
To see which of these five pain points is costing your service desk the most time, book an assessment. You walk away with a scorecard, a roadmap and a business case, in one week against a fixed scope.

The full article with its figures, tables and sources, set for reading offline, printing, and sharing.
On its way to your inbox You can also download it right now.
Download the PDF Last updatedKeep reading
Part of a series. This article is drawn from the L5 whitepaper on modernizing IT service management, and looks at the mo...
Read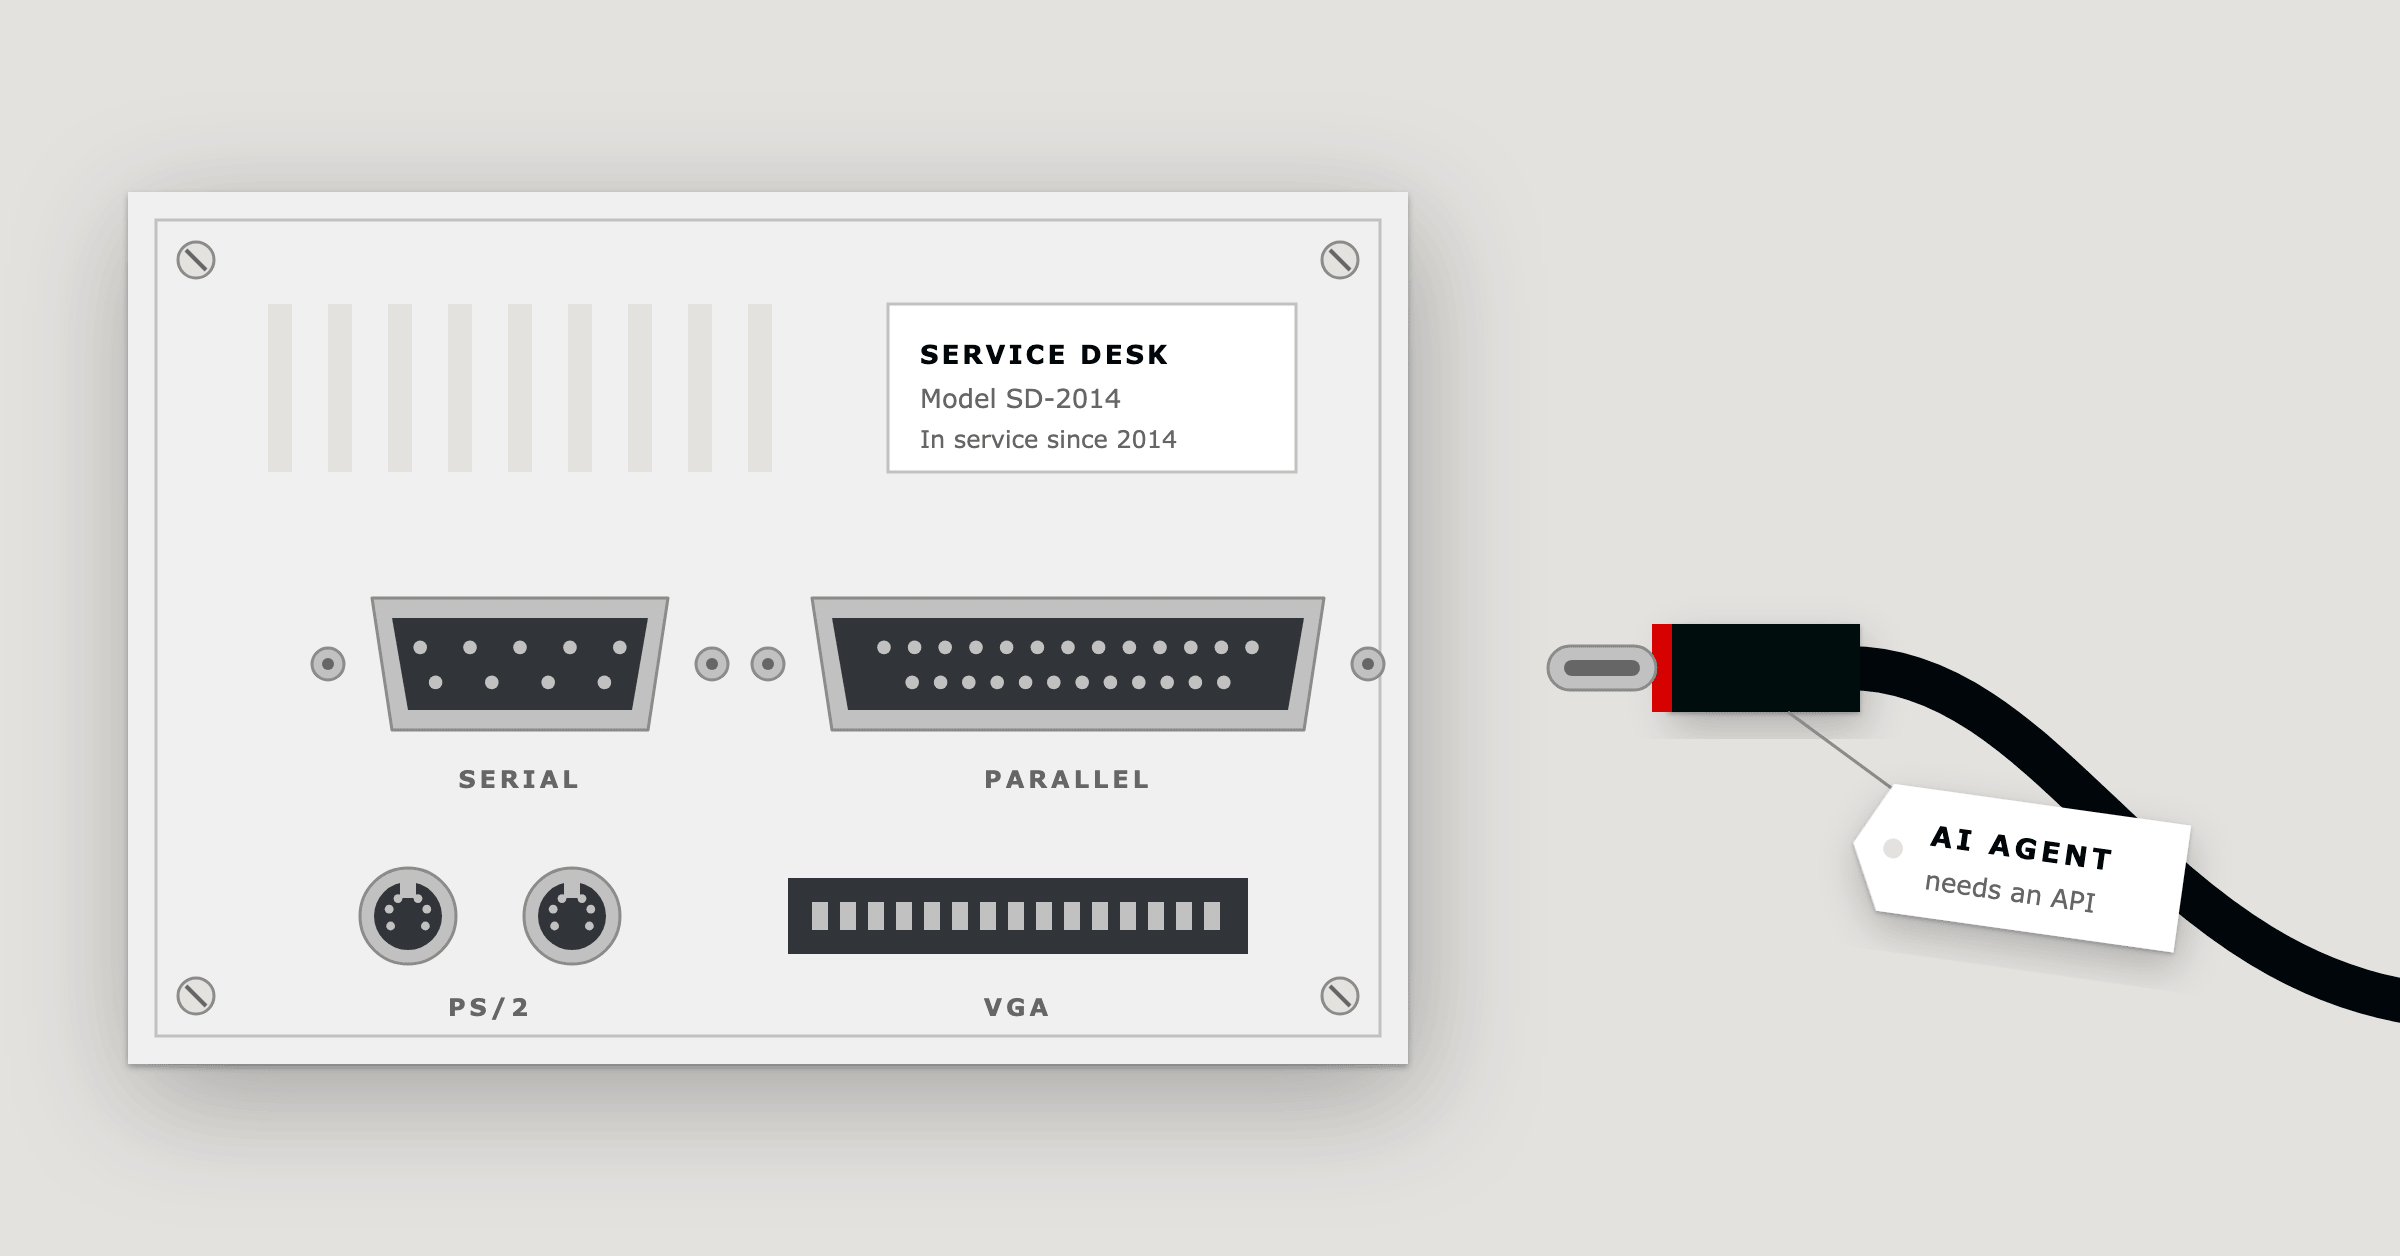
Part of a series. This article is drawn from the L5 white paper on modernizing IT service management, and looks one laye...
Read
Part of a series. This article is drawn from the L5 whitepaper on how people and AI resolve together, and looks at the l...
ReadField notes on AI operations and service management, direct to your inbox. New insights, the week we publish them.
No spam. Unsubscribe any time.